
Summary
This Power BI dashboard presents a detailed analysis of world population data across different decades, from 1970 to 2022. It allows users to explore population distribution by continent and analyze the top five countries with the largest populations. The dashboard includes the following features:
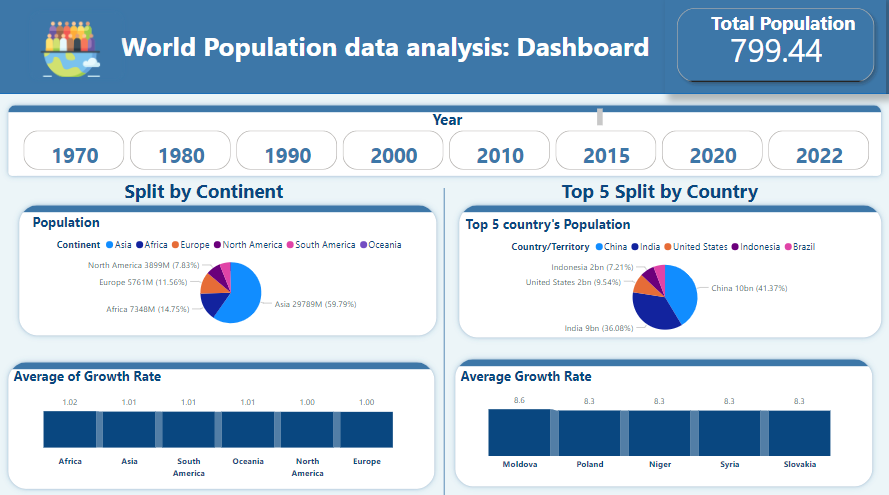
- Year Selection:
- A slider at the top allows users to select specific years from 1970 to 2022 to view population data for that period.
- Population Split by Continent:
- A pie chart displays the population distribution across continents, highlighting Asia as the most populous with 59.79%, followed by Africa at 14.75%, and Europe at 11.56%.
- Top 5 Countries by Population:
- Another pie chart focuses on the five countries with the highest populations, showing China leading with 41.37%, followed by India at 36.08%, and the United States at 9.54%.
- Average Growth Rate by Continent:
- A bar chart provides insights into the average population growth rate across continents, with rates varying slightly, indicating growth trends over time.
- Average Growth Rate by Country:
- Another bar chart highlights the average growth rates of specific countries like Moldova, Poland, and Niger, offering a comparative view of population growth dynamics.
- Total Population:
- The dashboard prominently displays the total global population as 799.44 million, providing a quick reference for the overall population size.
Excerpt
The World Population Data Analysis Dashboard offers a comprehensive view of global population trends from 1970 to 2022. With interactive features that allow users to explore population distribution by continent and identify the top five most populous countries, this dashboard provides essential insights into population dynamics. It also highlights the average growth rates across continents and specific countries, offering valuable data for demographic analysis and decision-making.