
Browse by category:
Data analysis (16) Excel (6) Extension (1) Market Research (21) Power BI (6) Probability (10) Projects (10) Python (6) SQL (2) Statistics (33) Visualization (11)
Sales Data Analysis of Euromart (Using Power BI)
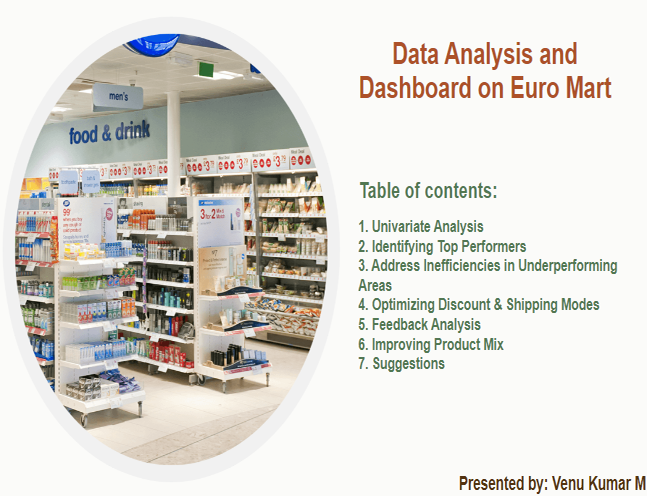
Univariate Analysis Key Insights: Identifying Top Performers Key Insights: Address operational inefficiencies underperforming areas Identifying and addressing underperforming areas within Euromart’s sales operations. It provides a detailed analysis of total sales and negative profit margins…
EDA on Euro Mart (Using Python and MYSQL)

Exploratory Data Analysis (EDA) Exploratory Data Analysis (EDA) is an approach to analyzing data sets to summarize the data, using statistical analysis and data visualization methods. It is a crucial step in any data analysis…
URL Navigator Chrome Extension
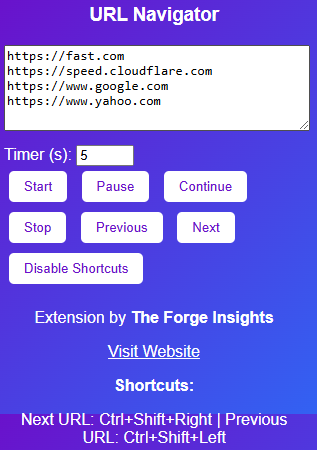
How to Use the URL Navigator Chrome Extension The URL Navigator is a handy Chrome extension that lets you move through a list of links easily in one browser tab. Follow this guide to learn…
Ease of doing business in India

The ease of doing business in India: progress and challenges India, one of the fastest-growing economies in the world, has made significant strides in improving its business environment over the past decade. With a growing…
A study on Supply Chain Management (SCM) of Pharmaceutical Industry

Table of Contents General Industry analysis Key players in pharmaceutical industry are Product channel Value chain of pharmaceutical industry Advantage in India for pharmaceuticals Structure of pharma sector in India Revenue by Indian pharma Current…
HR Analytics Dashboard (Using Power BI)
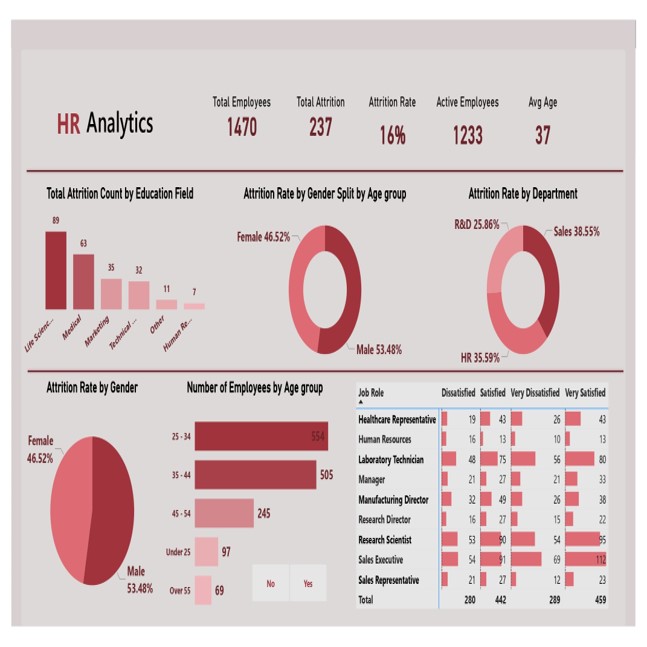
Key insights from the HR analytics dashboard Final takeaways This HR analytics dashboard provides a clear picture of employee attrition trends across various metrics such as department, education, gender, age, and satisfaction level. The data…
Amazon Prime shows analysis (Using Power BI)
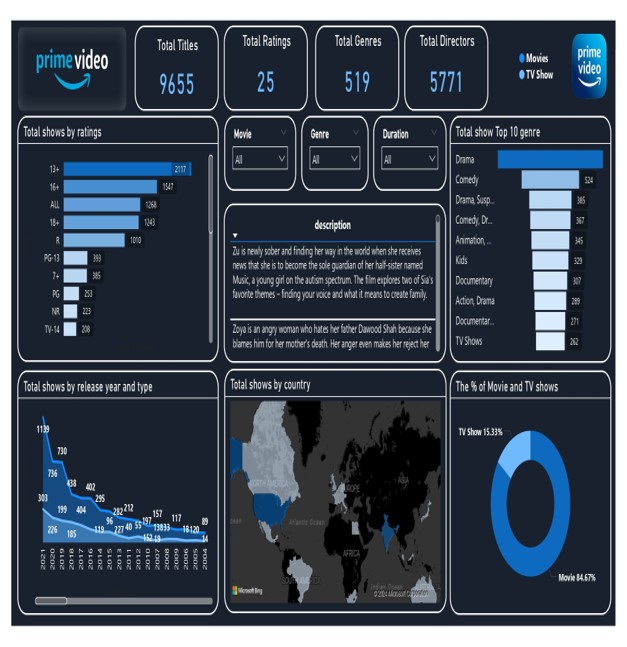
Key insights from Amazon Prime show dashboard Final takeaways
Socially Relevant Project

Ranga Rao Memorial School for Disabled Introduction of the organisation and functions. N R Foundation is the non-profitable trust of the N R Group, Sri N. Ranga Rao, founder of the NR group, strongly believed…
Personal Financial Planning (Market Research and Analysis)

CHAPTER 1 INDUSTRY OVERVIEW 1.0 Industry Overview Financial industry plays a major role in the economy of the country. As, financial industry is responsible for the movement of money or funds in the economy. Financial…
World Population Distribution (Using Power BI)
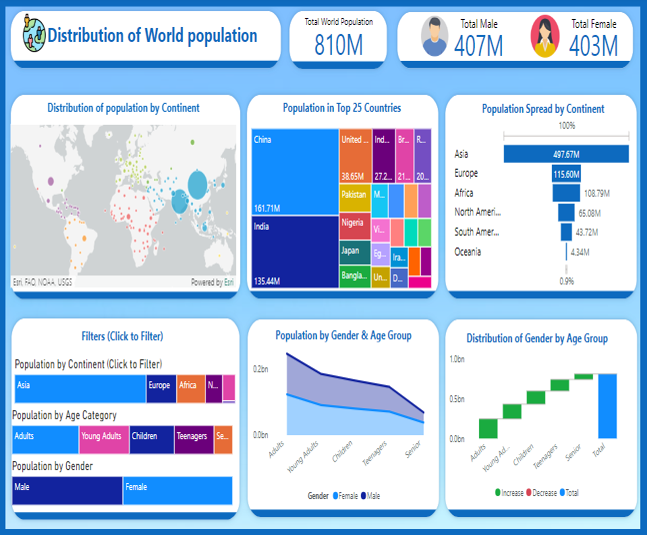
Summary This Power BI dashboard provides a detailed analysis of the global population distribution, offering insights into gender, age groups, and regional populations. Key features include: Excerpt The Distribution of World Population dashboard offers an…
World Population data analysis (Using Power BI)
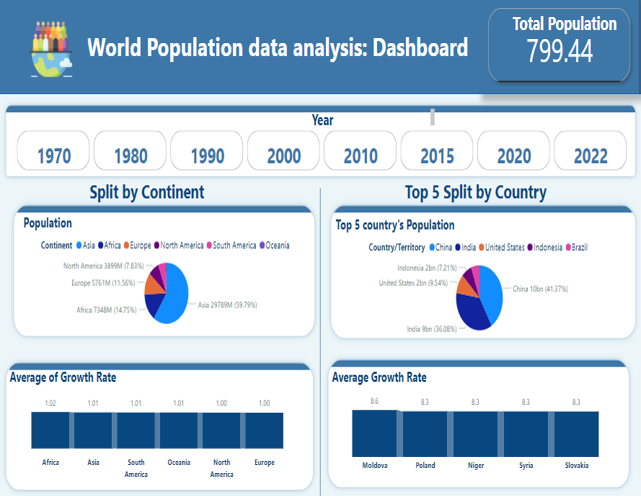
Summary This Power BI dashboard presents a detailed analysis of world population data across different decades, from 1970 to 2022. It allows users to explore population distribution by continent and analyze the top five countries…
GDP Analysis (Using Power BI)
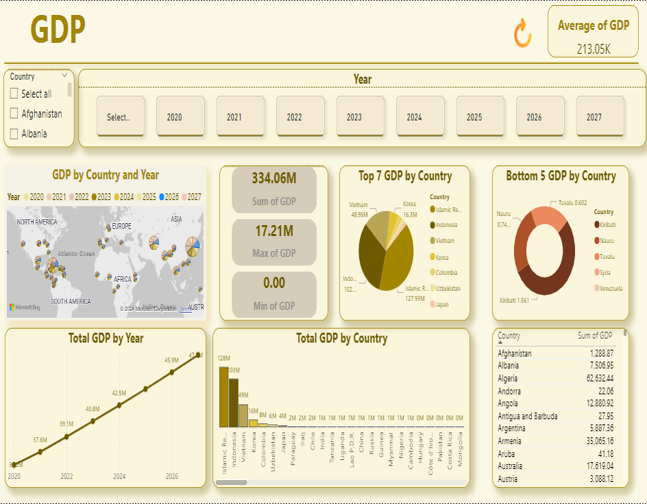
The Power BI dashboard offers a comprehensive visual representation of global GDP data spanning from 2020 to 2027. With interactive filters, users can select specific countries and years to explore detailed GDP trends and comparisons.…
Statistics for analytics (all in one)

What is statistics? Statistics used to analyze the data to draw conclusions from it What do we do using statistics? Descriptive Statistics We describe the data using statistical measures Inferential Statistics We take further actions…

The Forge Insights
Data Forged into Insights
Hub for Knowledge Sharing…