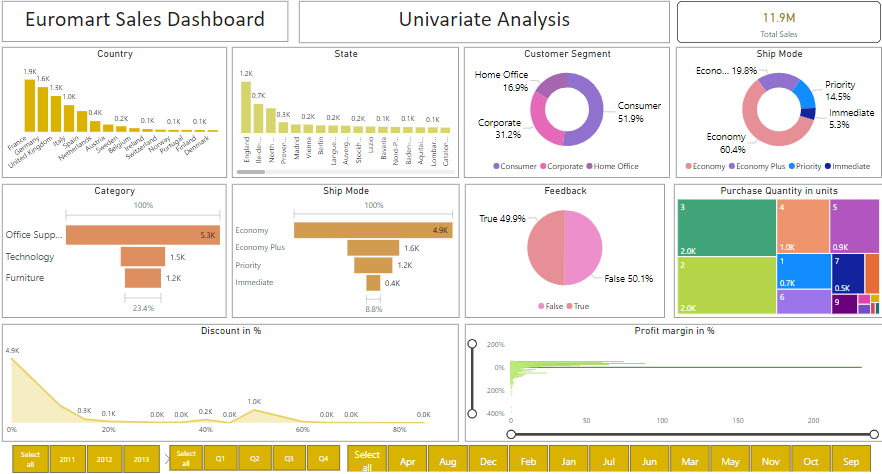
Univariate Analysis
Key Insights:
- Total Sales: The dashboard indicates a total sales figure of 11.9M.
- Country Distribution: France, Germany, and the United Kingdom appear to be the top-selling countries.
- Customer Segment: Consumer segments contribute the most to sales, followed by corporate and home office segments.
- Shipping Mode: Economy shipping is the most popular choice, followed by Economy Plus and Priority.
- Product Category: Office Supplies is the highest-selling category, followed by Technology and Furniture.
- Feedback: Feedback is generally positive, with 49.99% of customers providing true feedback.
- Purchase Quantity: The average purchase quantity is 3 units per order.
- Discount and Profit Margin: The dashboard shows discounts provided and profit margins achieved.
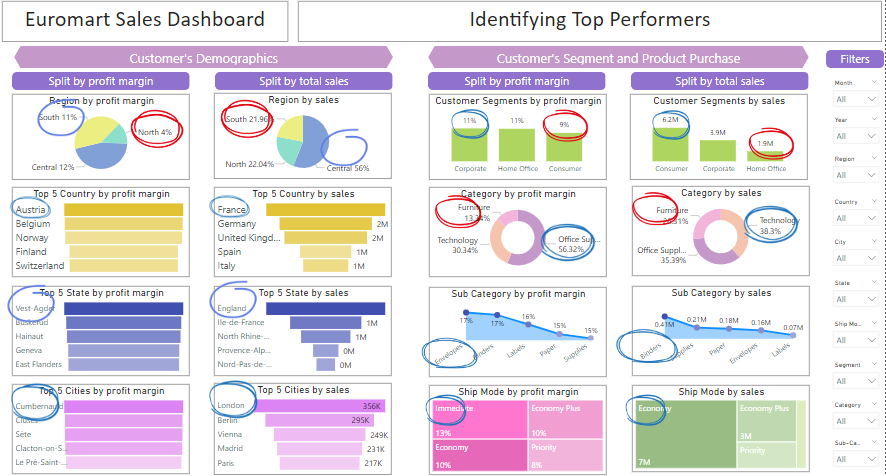
Identifying Top Performers
Key Insights:
- Top Performers: The dashboard identifies the top-performing regions, countries, states, and cities based on profit margin and total sales.
- Customer Demographics: The dashboard analyzes customer demographics and their purchasing behavior.
- Product Purchase: It provides insights into product category and sub-category performance, as well as shipping mode preferences.
- Profit Margin and Total Sales: The dashboard compares performance based on profit margin and total sales.

Address operational inefficiencies underperforming areas
Identifying and addressing underperforming areas within Euromart’s sales operations. It provides a detailed analysis of total sales and negative profit margins for the bottom-performing countries, states, and cities.
Key Insights:
- Bottom Performers: The dashboard highlights the countries, states, and cities that are contributing the least to total sales and/or have negative profit margins.
- Geographic Analysis: The visualizations offer a spatial representation of underperforming regions, allowing for easier identification and targeted intervention.
- Profit Margin Analysis: The dashboard provides a breakdown of negative profit margins, enabling a deeper understanding of the underlying issues.
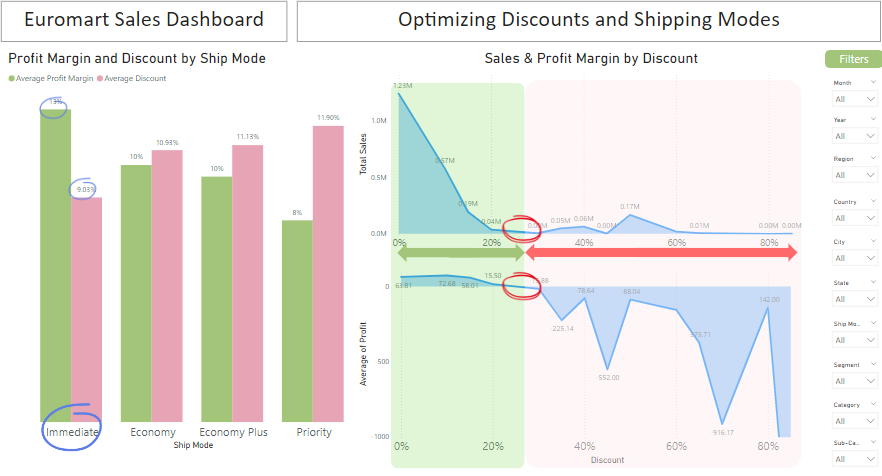
Optimizing discounts and shipping modes to improve profitability. It analyzes the relationship between profit margin, discount levels, and shipping mode choices.
Key Insights:
- Profit Margin and Discount: The dashboard reveals the impact of discount levels on profit margin for different shipping modes.
- Shipping Mode Analysis: It identifies the shipping mode that offers the highest profit margin at various discount levels.
- Optimal Discount Levels: The dashboard suggests potential optimal discount levels for each shipping mode to maximize profitability.
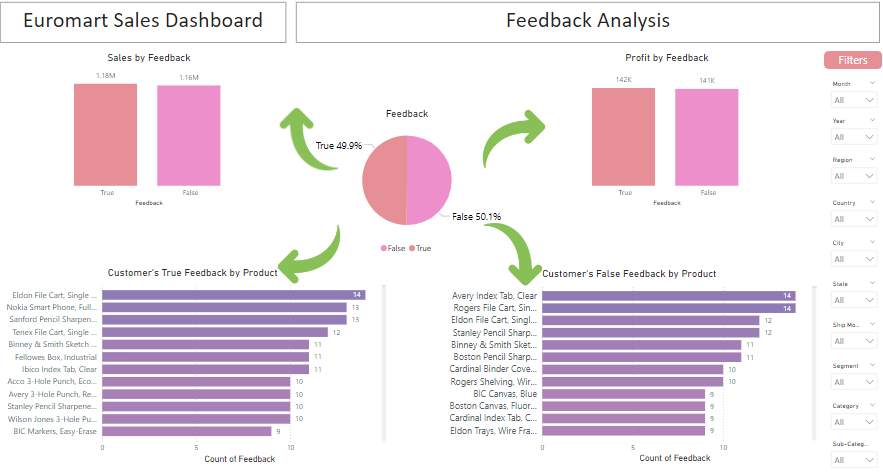
Feedback Analysis
Customer feedback and its impact on sales and profit.
Key Insights:
- Feedback Distribution: The dashboard shows that 49.9% of customers provided true feedback, while 50.1% provided false feedback.
- Sales by Feedback: True feedback is associated with higher sales compared to false feedback.
- Profit by Feedback: True feedback also leads to higher profit margins.
- Product-Level Analysis: The dashboard identifies the products that received the most true and false feedback, enabling targeted improvement efforts.

Improving Product Mix
Comprehensive analysis of product mix and performance.
Key Insights:
- Top-Selling and Loyal Customers: The dashboard identifies the top-selling products and customers with the highest purchase frequency.
- Profitable Products and Categories: It highlights the most profitable product categories and individual products.
- Selling Periods: The dashboard analyzes sales trends by week and quarter to identify peak selling periods.
- Product Mix: It provides insights into order size distribution by product category and sub-category.
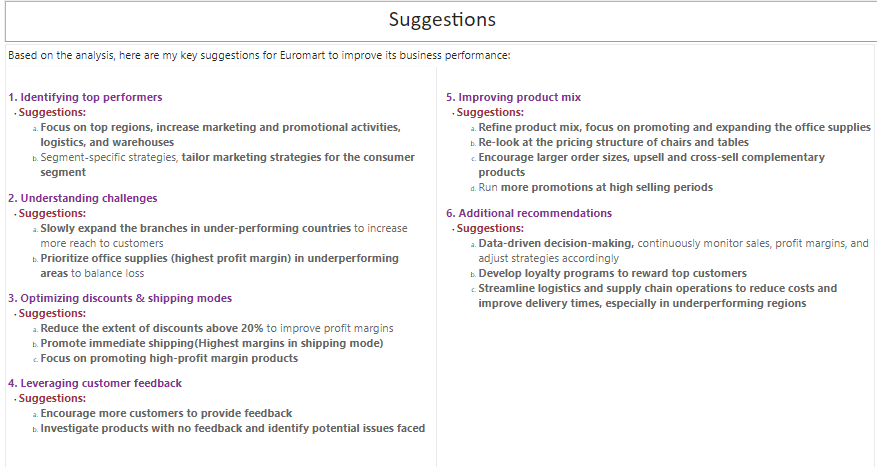
Summary
Based on the analysis, here are my key suggestions for Euromart to improve its business performance:
1. Identifying top performers
- Suggestions:
- Focus on top regions, increase marketing and promotional activities, logistics, and warehouses
- Segment-specific strategies, tailor marketing strategies for the consumer segment
2. Understanding challenges
- Suggestions:
- Slowly expand the branches in under-performing countries to increase more reach to customers
- Prioritize office supplies (highest profit margin) in underperforming areas to balance loss
3. Optimizing discounts & shipping modes
- Suggestions:
- Reduce the extent of discounts above 20% to improve profit margins
- Promote immediate shipping(Highest margins in shipping mode)
- Focus on promoting high-profit margin products
4. Leveraging customer feedback
- Suggestions:
- Encourage more customers to provide feedback
- Investigate products with no feedback and identify potential issues faced
5. Improving product mix
- Suggestions:
- Refine product mix, focus on promoting and expanding the office supplies
- Re-look at the pricing structure of chairs and tables
- Encourage larger order sizes, upsell and cross-sell complementary products
- Run more promotions at high selling periods
6. Additional recommendations
- Suggestions:
- Data-driven decision-making, continuously monitor sales, profit margins, and adjust strategies accordingly
- Develop loyalty programs to reward top customers
- Streamline logistics and supply chain operations to reduce costs and improve delivery times, especially in underperforming regions