Key insights from the HR analytics dashboard
- Total employees and attrition rate
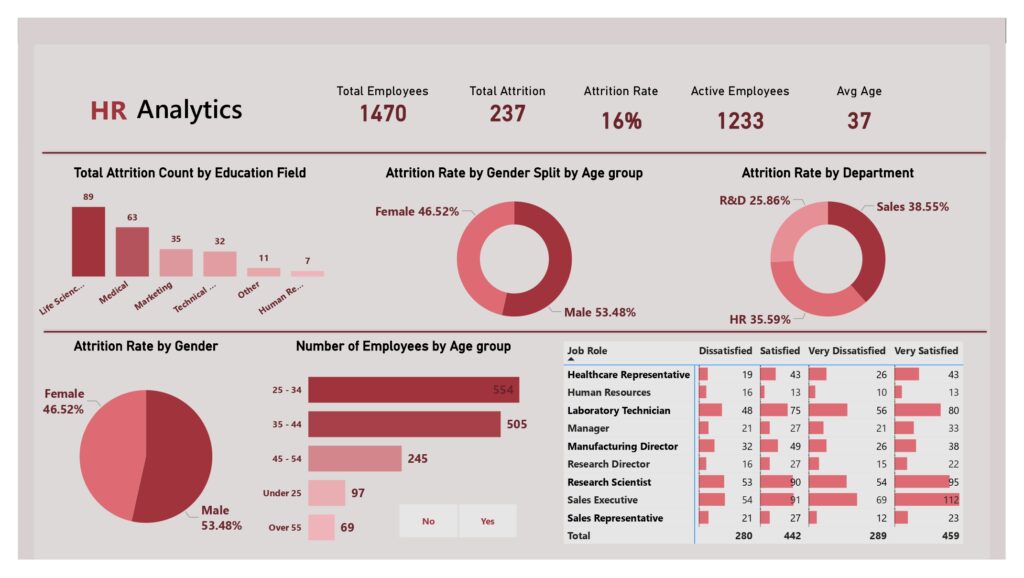
- Total employees: the organization has 1,470 employees in total.
- Total attrition: out of this, 237 employees have left the company, resulting in an overall attrition rate of 16%.
- Active employees: after attrition, the company currently has 1,233 active employees, with the average age of employees being 37 years.
- Attrition by education field
- The dashboard reveals that the highest attrition comes from the life sciences (89 employees) and medical (63 employees) fields, while the human resources department has the lowest attrition, with only 7 employees leaving.
- Other fields like marketing (35), technical (32), and other fields (11) also contribute to the overall attrition.
- Attrition rate by gender
- The gender split in the attrition rate shows a fairly balanced distribution:
- Males: 53.48%
- Females: 46.52%
- This indicates that attrition rates are relatively equal between male and female employees, with a slight tendency towards male employees leaving at a higher rate.
- The gender split in the attrition rate shows a fairly balanced distribution:
- Attrition by department
- Sales has the highest attrition rate at 38.55%, which could suggest potential dissatisfaction or high turnover in this department.
- HR also faces a significant attrition rate of 35.59%, indicating that employee retention in this department could be a challenge.
- In comparison, the R&D department has a lower attrition rate of 25.86%, implying a more stable workforce.
- Attrition by age group
- The highest number of employees who have left belong to the 25-34 age group (554 employees), followed by the 35-44 age group (505 employees).
- The 45-54 age group sees a lower attrition number (245 employees), and those under 25 (97 employees) and over 55 (69 employees) have even lower attrition rates.
- This suggests that younger employees may have higher turnover, possibly due to career changes or job dissatisfaction early in their careers.
- Employee satisfaction by job role
- The satisfaction analysis section provides insights into how employees in different job roles feel about their work:
- Sales executives and sales representatives show high levels of dissatisfaction, with 91 dissatisfied sales executives and 21 dissatisfied sales representatives. This correlates with the high attrition rate in the sales department.
- Research scientists have a high number of employees who are very satisfied (95 employees), which aligns with the lower attrition in r&d.
- The healthcare representative role also shows a balanced satisfaction level, with 43 employees marking themselves as “satisfied” and 43 as very satisfied.
- This breakdown suggests that roles in research and healthcare see higher satisfaction levels, while sales roles face more dissatisfaction and turnover.
- The satisfaction analysis section provides insights into how employees in different job roles feel about their work:
Final takeaways
This HR analytics dashboard provides a clear picture of employee attrition trends across various metrics such as department, education, gender, age, and satisfaction level. The data reveals key trends that could help HR teams focus on reducing attrition and improving job satisfaction. Key takeaways include:
- Sales and HR departments have higher attrition rates, suggesting these areas need a deeper review of work conditions and retention strategies.
- The 25-34 age group sees the highest turnover, likely due to younger employees seeking better career opportunities or job dissatisfaction.
- Gender differences in attrition are minimal, with only a slight male dominance in the attrition rate, indicating no significant gender bias in employee retention.
- Job satisfaction insights highlight that roles in sales are more likely to be associated with dissatisfaction, while roles in research and healthcare exhibit higher satisfaction and retention.