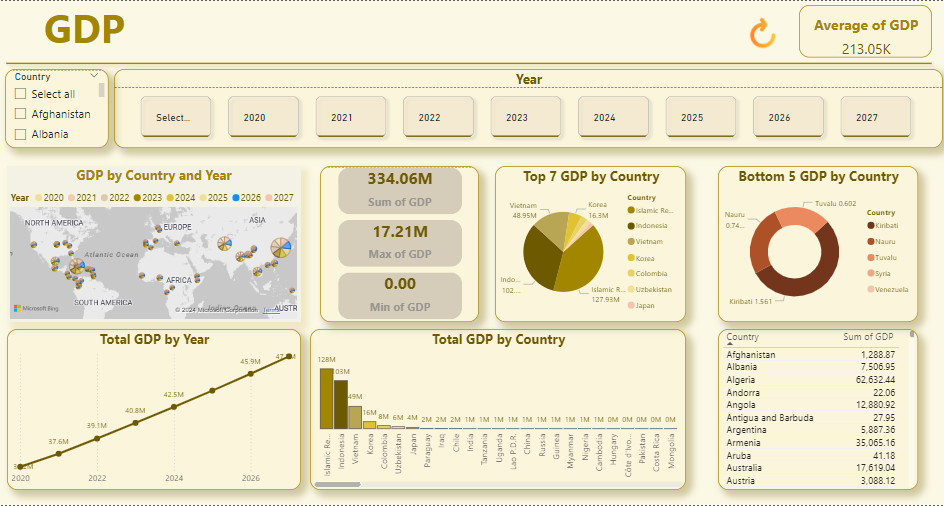
The Power BI dashboard offers a comprehensive visual representation of global GDP data spanning from 2020 to 2027. With interactive filters, users can select specific countries and years to explore detailed GDP trends and comparisons.
Key features include a global map highlighting GDP distribution, charts showcasing the top and bottom GDP contributors, and a detailed view of total GDP growth over time. Additionally, the dashboard provides crucial statistics such as the sum, maximum, minimum, and average GDP values, making it an essential tool for economic analysis and insights into global financial trends.
This Power BI dashboard provides an in-depth overview of the Gross Domestic Product (GDP) data across various countries from 2020 to 2027. Here’s a summary of the key features:
- Country Selection & Year Filter:
- A filter at the top allows users to select specific countries to view their GDP data.
- Users can choose different years (from 2020 to 2027) to analyze GDP trends over time.
- GDP by Country and Year Map:
- A world map visually displays GDP data for selected countries across different years. This map helps users understand geographic distribution and changes in GDP over time.
- Total GDP Statistics:
- A section highlights the total sum of GDP (334.06M), the maximum GDP value recorded (17.21M), and the minimum GDP value (0.00).
- Top 7 GDP by Country:
- A pie chart shows the countries with the highest GDP, including Vietnam, Korea, Indonesia, and others, helping to identify the leading economies.
- Bottom 5 GDP by Country:
- Another pie chart displays the countries with the lowest GDP, such as Nauru, Tuvalu, Kiribati, and Venezuela, providing insights into smaller or struggling economies.
- Total GDP by Year (2020-2027):
- A line chart visualizes the growth in GDP over the years, indicating a rising trend in global GDP from 30 M in 2020 to 47M in 2027.
- Total GDP by Country:
- A bar chart compares GDP across different countries, with specific emphasis on major contributors like the United States, China, and India.
- Country List with GDP Values:
- A table on the right lists individual countries along with their total GDP, allowing for easy comparison and reference.
- Average GDP:
- The dashboard also shows the average GDP value, which is 213.05K, providing a benchmark for comparison.
This dashboard offers a comprehensive overview of global GDP distribution, trends, and country-specific insights, useful for economic analysis and decision-making.