
Excel basics for beginners
1. Introduction to excel
- Excel is a powerful spreadsheet tool by Microsoft used for data analysis, calculations, and visualization.
- Commonly used in various fields like finance, marketing, project management, and data analysis.
2. Getting started with excel
- Opening excel: double-click on the excel icon or search for it in the start menu.
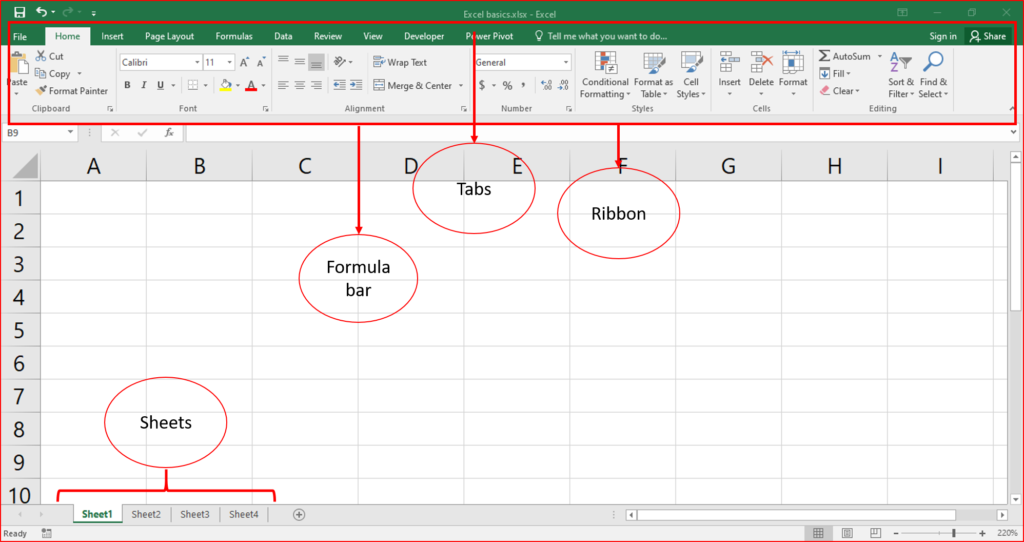
- Interface overview:
- Workbook: the file you work in. A workbook can contain multiple sheets.
- Worksheet: a single sheet within a workbook, made up of cells arranged in rows and columns.
- Ribbon: the toolbar at the top, organized into tabs (home, insert, page layout, etc.) Containing various tools.
- Formula bar: the area where you can enter or edit data/formulas in the selected cell.
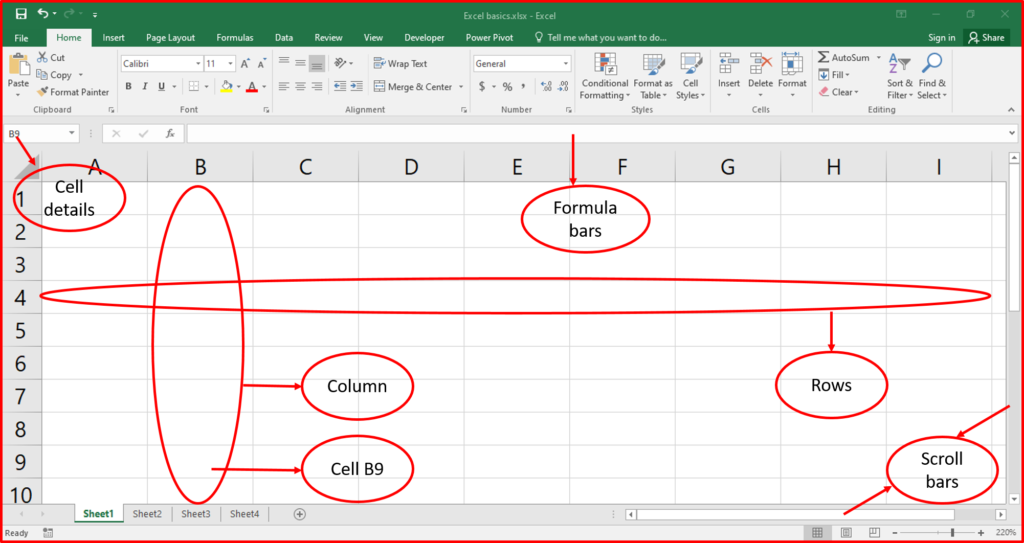
3. Working with cells
- Selecting cells: click on a cell or click and drag to select multiple cells.
- Entering data: click on a cell and start typing. Press enter to move to the cell below.
- Editing data: double-click on a cell to edit its contents, or click once and edit in the formula bar.
- Autofill: drag the small square at the bottom right corner of a cell to fill adjacent cells with a series or copy the cell’s content.
4. Basic formulas and functions
- Formulas: start with = followed by the operation (e.g., =a1 + b1).
- Functions: predefined formulas for common calculations. Examples:
- Sum: =sum(a1:a5) adds all numbers in the range a1 to a5.
- Average: =average(b1:b5) calculates the average of numbers in the range b1 to b5.
- Min/max: =min(c1:c10) or =max(c1:c10) finds the smallest or largest number in the range c1 to c10.
- Using cell references: reference other cells in your formulas, so they update automatically when values change.
5. Formatting your spreadsheet
- Text formatting: use the options in the home tab to change the font, size, color, and style (bold, italic, underline) of your text.
- Cell formatting: adjust cell borders, background colors, and alignment (left, center, right).
- Number formatting: change how numbers appear (e.g., currency, percentage, date) using the number group in the home tab.
- Conditional formatting: highlight cells based on specific conditions (e.g., color cells red if the value is less than 50).
6. Sorting and filtering data
- Sorting: arrange your data in ascending or descending order by clicking on the sort buttons in the data tab.
- Filtering: use filters to view only the data that meets certain criteria. Click on the filter icon in the data tab and choose your filter options.
7. Basic data visualization
- Inserting charts:
- Highlight your data range.
- Go to the insert tab and choose the type of chart (e.g., bar, line, pie).
- Customize your chart with titles, labels, and colors.
- Creating sparklines: tiny charts within a cell that give a visual trend. Insert them from the insert tab under sparklines.
8. Saving and sharing your work
- Saving: click file > save as to save your workbook. Choose a location and file name. Save regularly to avoid losing work.
- Exporting: you can export your workbook as a pdf or share it directly via email.
- Cloud storage: save your workbook to onedrive for easy access and sharing.
9. Keyboard shortcuts
- Basic shortcuts:
- Ctrl + c: copy
- Ctrl + v: paste
- Ctrl + z: undo
- Ctrl + s: save
- Navigation shortcuts:
- Ctrl + arrow keys: move to the edge of the data region.
- Ctrl + shift + arrow keys: select a range of cells.
- Ctrl + home/end: move to the beginning or end of the worksheet.
Conclusion
Mastering these basics will set you up for more advanced excel skills. Practice these steps, and soon, you’ll be handling data like a pro!