Browse by category:
Data analysis (16) Excel (6) Extension (1) Market Research (21) Power BI (6) Probability (10) Projects (10) Python (6) SQL (2) Statistics (33) Visualization (11)
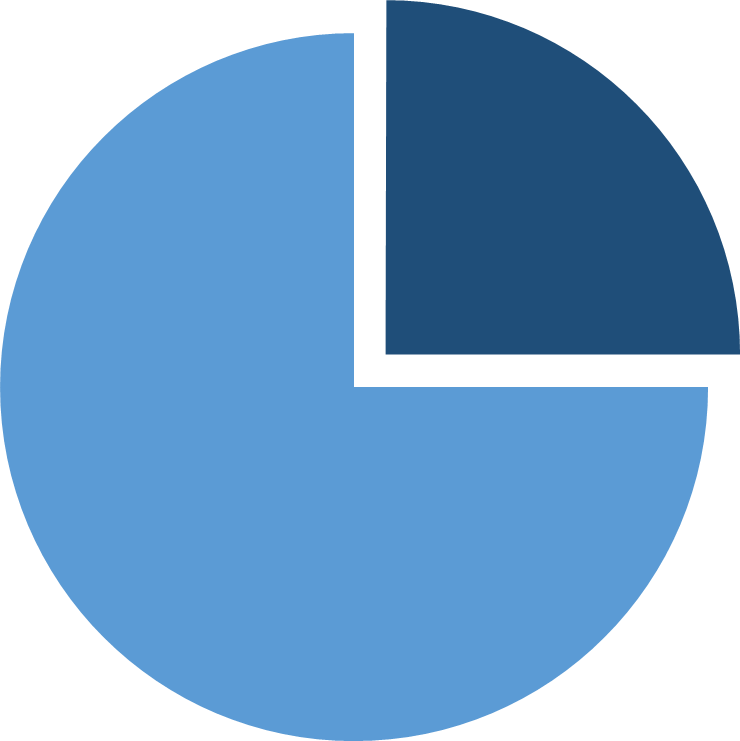
Population Vs Sample
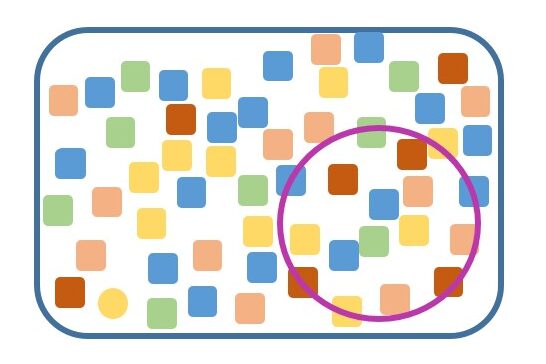
Population Vs Sample What is population? A population is the whole group that we want to draw conclusions What is a sample? A sample is a part of the population, typically it shall represent majority…
IRQ – Inter Quartile Range
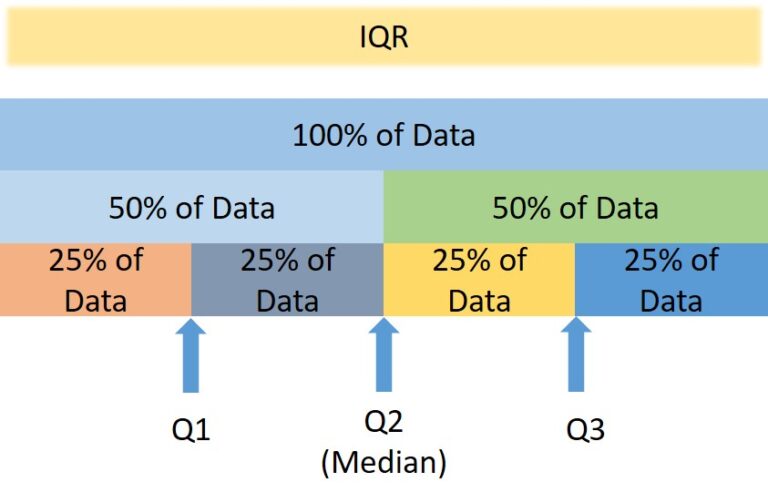
Inter Quartile Range (IQR) IQR helps to understand spread of data, by dividing the data in to 4 pieces (also known as quarters) Example: Imagine there are some set of numbers give, we wanted to…
Kurtosis
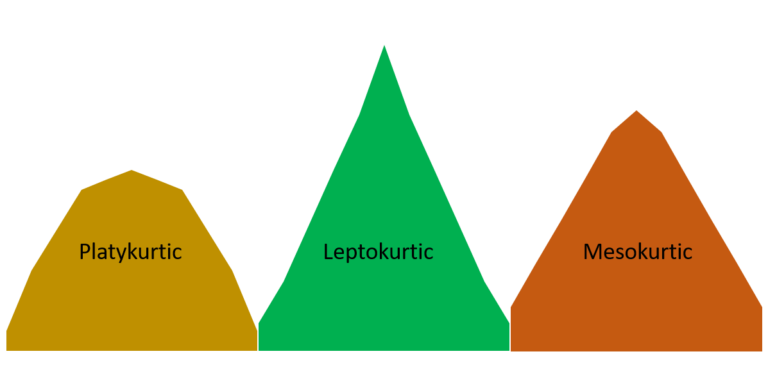
Kurtosis we measure the shape of cure w.r.t height. It describes how much the deviation is from a normal (bell-shaped) curve Note: Kurtosis is analyzed alongside skewness, this describes the asymmetry of a distribution. While…
Skewness
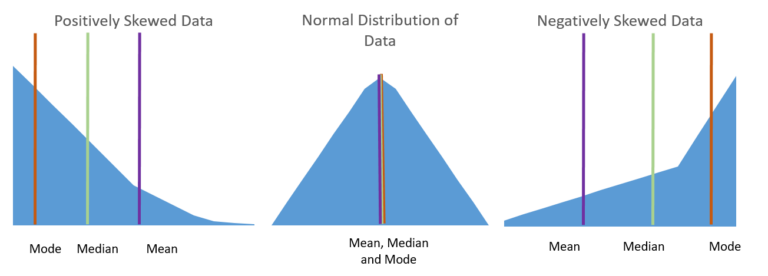
Skewness describes how the data points spread around the mean, particularly whether they lean more towards one side (left or right) or are relatively symmetrical Types of Skewness: Positive Skewness: The tail of the distribution…
What is measure of dispersion? (Data spread – range, variance and standard deviation)

What is measure of dispersion? (Data spread – range, variance and standard deviation) Here we see how the data points are spread, it tells us how much variation is there from central tendency Range: Here…
Scales of measurements of data

Scales of measurements of data Nominal Scale: Represents categories with no ranking, it only represents categories of data. Example: Blood group, customer segments What operation can we do on nominal scale? We can perform count…
Types of statistics

Descriptive statistics Here we are summarizing the data, we are describing the characteristics of data and finding relation among the variables in data What do we perform in descriptive statistics? Inferential statistics Here we are…
What is Mean, Median, Mode (Central Tendency)?

What is Mean? Mean is known as average, which represents middle point in data. We can say that mean is most common value in the data. Example: Age of 3 students are, 12, 15, 18.…
What is a variables?
In statistics variable is something that can change or vary, with or without any conditions Note: Values of variable could be measured w.r.t numerical scale (could be either continuous or discrete) or non measurable as well…
What is data?

What is data? Data is essentially a collection of anything from numbers and figures to text and symbols. It is basically unprocessed information. Example of data: Note: data should be stored either in digital or…

The Forge Insights
Data Forged into Insights
Hub for Knowledge Sharing…