

URL Navigator Chrome Extension
How to Use the URL Navigator Chrome Extension The URL Navigator is a handy Chrome extension that lets you move through a list of links easily in one browser tab. Follow this guide to learn how to set it up…
How to Use the URL Navigator Chrome Extension The URL Navigator is a handy Chrome extension that lets you move through a list of links easily in one browser tab. Follow this guide to learn how to set it up…
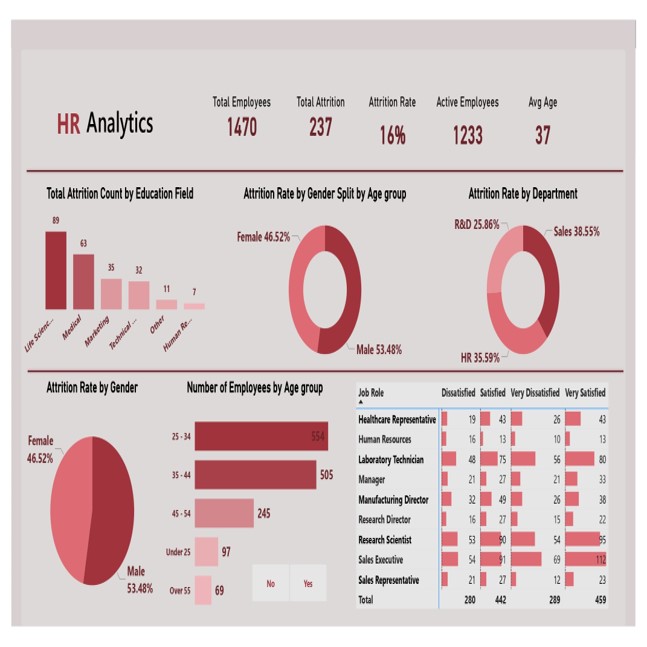
Key insights from the HR analytics dashboard Final takeaways This HR analytics dashboard provides a clear picture of employee attrition trends across various metrics such as department, education, gender, age, and satisfaction level. The data reveals key trends that could…
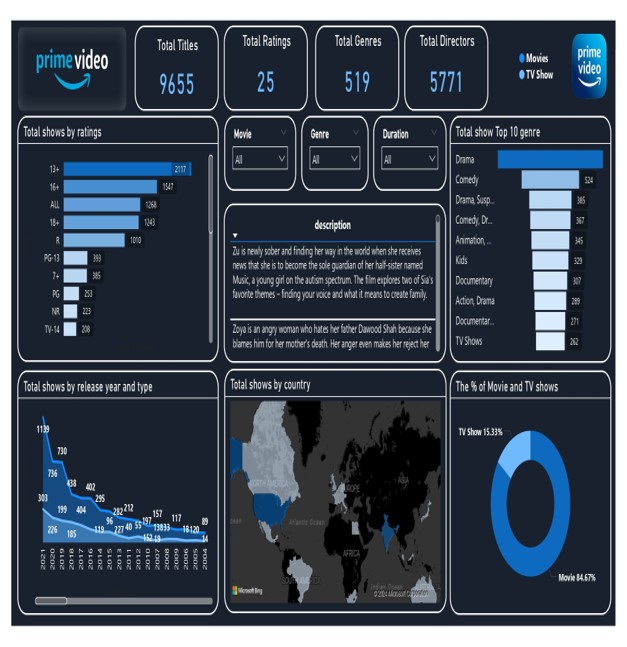
Key insights from Amazon Prime show dashboard Final takeaways

CHAPTER 1 INDUSTRY OVERVIEW 1.0 Industry Overview Financial industry plays a major role in the economy of the country. As, financial industry is responsible for the movement of money or funds in the economy. Financial industry helps people or organization…
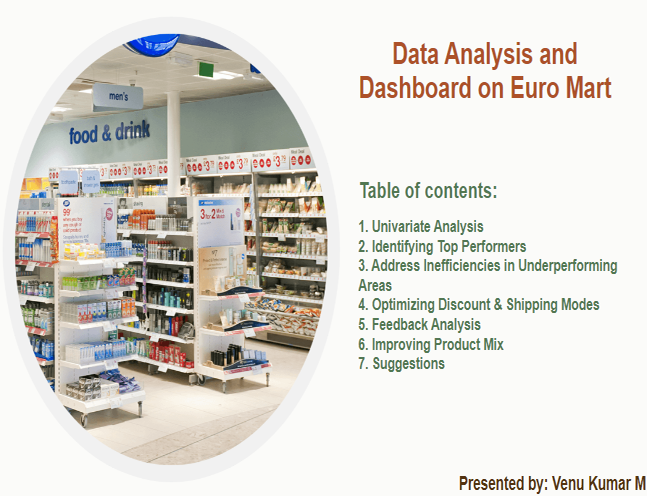
Univariate Analysis Key Insights: Identifying Top Performers Key Insights: Address operational inefficiencies underperforming areas Identifying and addressing underperforming areas within Euromart’s sales operations. It provides a detailed analysis of total sales and negative profit margins for the bottom-performing countries, states,…
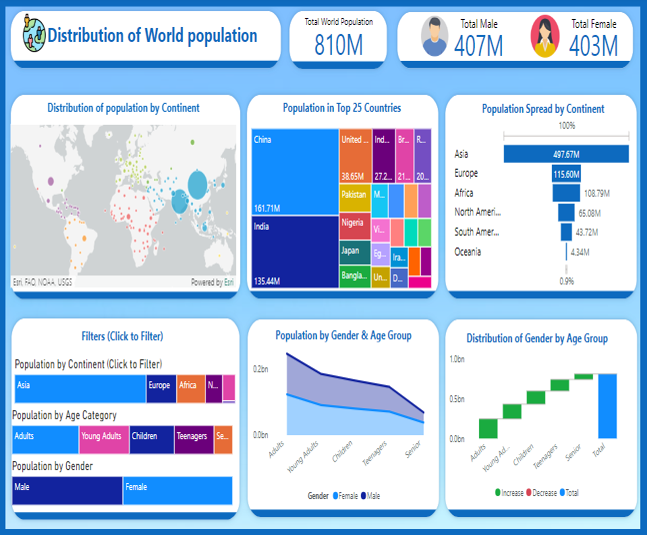
Summary This Power BI dashboard provides a detailed analysis of the global population distribution, offering insights into gender, age groups, and regional populations. Key features include: Excerpt The Distribution of World Population dashboard offers an insightful look into the global…
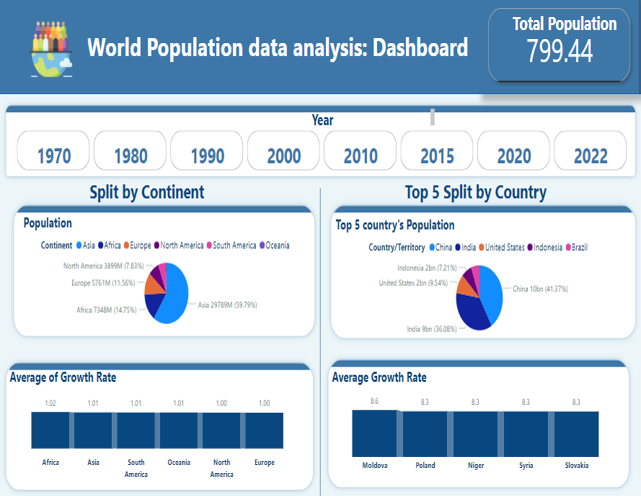
Summary This Power BI dashboard presents a detailed analysis of world population data across different decades, from 1970 to 2022. It allows users to explore population distribution by continent and analyze the top five countries with the largest populations. The…
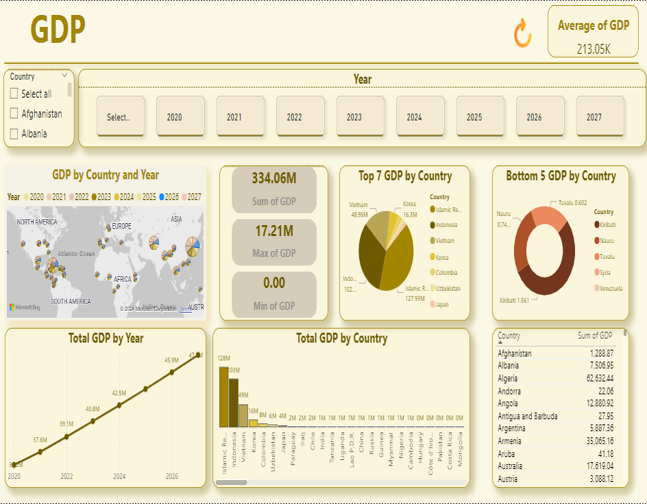
The Power BI dashboard offers a comprehensive visual representation of global GDP data spanning from 2020 to 2027. With interactive filters, users can select specific countries and years to explore detailed GDP trends and comparisons. Key features include a global…

What is statistics? Statistics used to analyze the data to draw conclusions from it What do we do using statistics? Descriptive Statistics We describe the data using statistical measures Inferential Statistics We take further actions from descriptive statistics, here we…
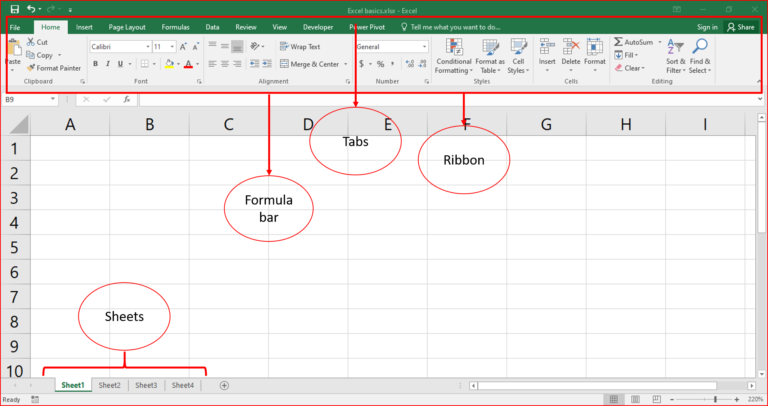
Excel basics for beginners 1. Introduction to excel 2. Getting started with excel 3. Working with cells 4. Basic formulas and functions 5. Formatting your spreadsheet 6. Sorting and filtering data 7. Basic data visualization 8. Saving and sharing your…

Exploratory Data Analysis (EDA) Exploratory Data Analysis (EDA) is an approach to analyzing data sets to summarize the data, using statistical analysis and data visualization methods. It is a crucial step in any data analysis process, enabling data analysts to…

For any distribution regardless of shape the portion of data lying within k standard deviations (k > 1) of the mean is at least 1 – 1/(K^2) Eg: mean = 6, Standard deviation = 3.84 For k = 2, at…

Pandas Series is like a column (has only one dimension), and a DataFrame (has two dimensions) is like a table or a spreadsheet with rows and columns Create panda series Method Syntax Description Example From a list pd.Series(data=list) Series from…

Here i like to show some examples using NumPy, Please copy and paste the codes in your environement to practice Note: The below examples are made for practice purpose, so not much details are given. Better suited for the experienced…

Numpy Library in Python for numerical computations, data manipulation & mathematical functions Feature Python List NumPy Array Data type Any data type Same data type Mutability Mutable Partially mutable (elements can modified, size and shape cannot) Performance Slower for numerical…
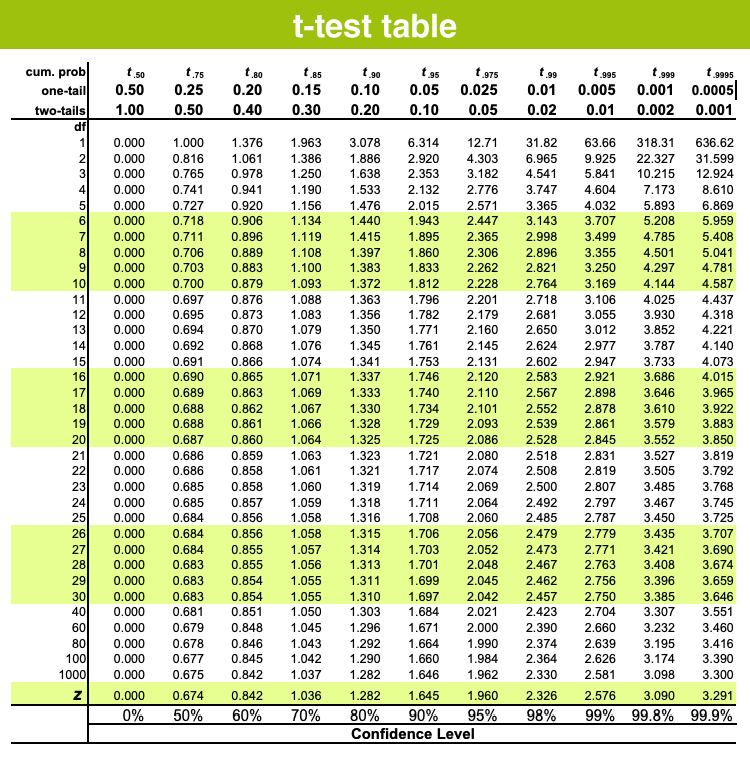
When Student’s T test should be used? Typically we usually don’t get population standard deviation in real life examples, such that we cannot calculate the standard deviation of population (σ_population) and Z score. So we use Student T test to…

Example 1 A store believes that new product has 100 sales per day compared to their old product. We want to test this claim statistically Sample size = 10 stores = n, sample mean = 103 = x̄, Standard deviation…

Confidence Interval (CI): Range of values that is to contain the true population parameter (mean, proportion) with certain level of confidence Margin of Error (ME): Amount of uncertainty/ potential error our estimate or Confidence Interval Relationship between Confidence Interval and…

Hypothesis is an educated guess or a tentative statement about the relationship between two or more variables Types of Hypothesis: Note: We are collecting enough evidence to say that hypothesis to accept or reject the hypothesis How Hypothesis works? Note:…

Poisson distribution focuses on the number of events occurring in a specific interval (time, space, etc.) One parameter (λ) represents the average rate of events occurring within the interval, it will be the expected value from experiment Poisson distribution deals…